
We’ve progressed through Logical Sequence, Blood Relations, Syllogisms, Series Completion, Cause-Effect, and Dice, building visual and logical reasoning with each chapter. Today’s topic, Venn Diagrams, combines the logical deduction skills you’ve developed with the visual representation skills from dice problems. After training IBPS, SBI, SSC, and Railway aspirants for years, I’ve noticed that students often struggle with Venn diagrams not because they can’t visualize circles, but because they don’t systematically convert statements into diagram representations. The real skill, which I want to share today, is understanding that Venn diagrams are visual representations of set relationships. Once you learn to convert statements into diagram positions, answering questions becomes mechanical rather than intuitive. Let’s master this.
1. Understand Set Theory Basics Before Drawing Diagrams
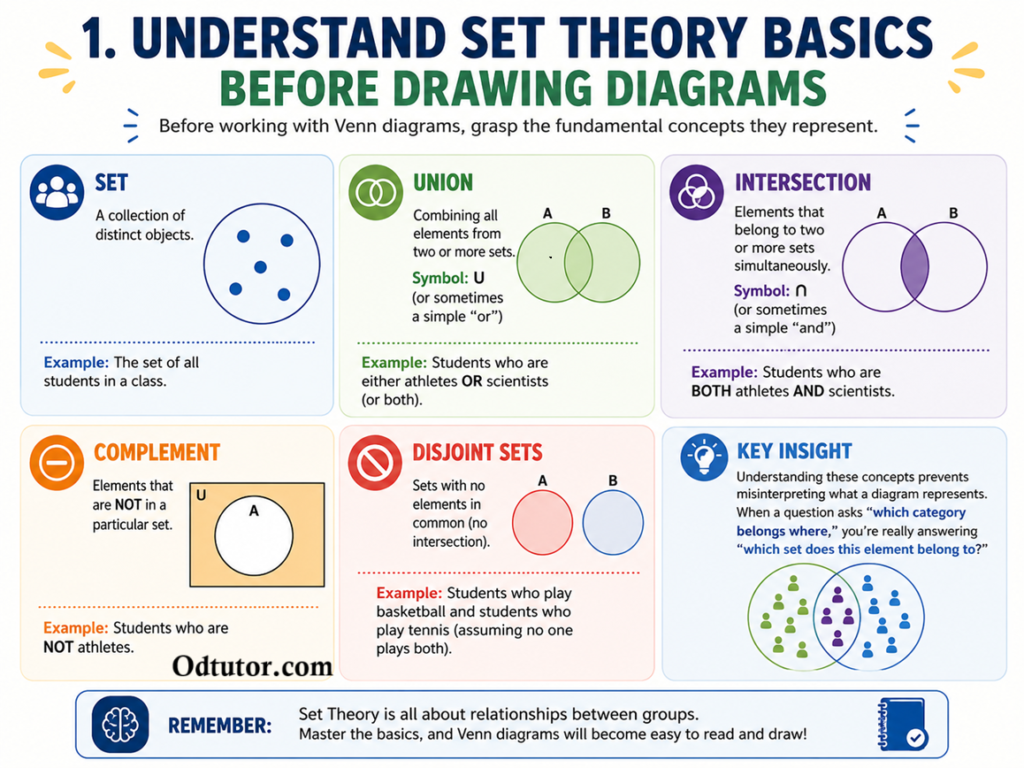
Before working with Venn diagrams, grasp the fundamental concepts they represent.
Set: A collection of distinct objects. Example: The set of all students in a class.
Union: Combining all elements from two or more sets. Symbol: U (or sometimes a simple “or”) Example: Students who are either athletes OR scientists (or both).
Intersection: Elements that belong to two or more sets simultaneously. Symbol: n (or sometimes a simple “and”) Example: Students who are BOTH athletes AND scientists.
Complement: Elements that are NOT in a particular set. Example: Students who are NOT athletes.
Disjoint Sets: Sets with no elements in common (no intersection). Example: Students who play basketball and students who play tennis (assuming no one plays both).
Key insight: understanding these concepts prevents misinterpreting what a diagram represents. When a question asks “which category belongs where,” you’re really answering “which set does this element belong to?”
2. Master Two-Set Venn Diagrams
Two-set diagrams show the relationship between two groups. Start here before attempting three-set problems.
Structure: Two overlapping circles.
- Left circle only: elements in Set A but not Set B
- Right circle only: elements in Set B but not Set A
- Overlap: elements in both Set A and Set B
- Outside both circles: elements in neither set
Example: All teachers are educated. Some teachers are musicians.
Translation to diagram:
- Set A (Teachers) and Set B (Educated)
- Since all teachers are educated, the entire Teachers circle sits inside the Educated circle
- No Teachers exist outside Educated
If additionally “Some teachers are musicians”:
- Set C (Musicians) overlaps with Set A (Teachers)
- The overlap region shows teachers who are also musicians
Practicing two-set problems builds intuition for understanding overlap regions and “only” versus “both” distinctions.
3. Handle Three-Set Venn Diagrams Systematically
Three-set diagrams show three groups and their intersections. They create seven distinct regions.
Structure: Three overlapping circles.
- Region 1: Only A (not B, not C)
- Region 2: Only B (not A, not C)
- Region 3: Only C (not A, not B)
- Region 4: A and B (not C)
- Region 5: B and C (not A)
- Region 6: A and C (not B)
- Region 7: All three (A and B and C)
- Outside all circles: Elements in none of the sets
Example: All doctors are educated. Some doctors are musicians. No doctors are poor.
Translation to three-set diagram:
- Set A (Doctors), Set B (Educated), Set C (Musicians), Set D (Poor)
- Doctors circle sits inside Educated circle (all doctors are educated)
- Doctors and Musicians overlap partially (some doctors are musicians)
- Doctors circle and Poor circle don’t overlap at all (no doctors are poor)
Systematically identifying each region prevents misplacing information.
4. Convert Statements Into Diagram Positions
The skill that separates strong Venn diagram students from weak ones is converting language into positions.
Statement type 1: “All A are B” Diagram: Circle A sits completely inside Circle B
Statement type 2: “Some A are B” (or “At least one A is B”) Diagram: Circle A overlaps with Circle B, but parts of A extend outside B
Statement type 3: “No A are B” (or “A and B are disjoint”) Diagram: Circles A and B don’t touch at all
Statement type 4: “Some A are not B” Diagram: Part of Circle A extends outside Circle B
Example problem: Convert these statements into a diagram.
- All engineers are educated
- Some engineers are athletes
- No engineer is unemployed
Diagram:
- Engineers circle inside Educated circle (all engineers are educated)
- Engineers overlaps with Athletes (some engineers are athletes)
- Engineers and Unemployed circles don’t touch (no engineers are unemployed)
Systematic conversion prevents misinterpretation.
5. Recognize Common Logical Fallacies in Venn Diagrams
Exam questions test whether you can spot invalid conclusions.
Fallacy 1: Assuming “Some A are B” means “Some B are A” Invalid: “Some doctors are musicians” does NOT imply “Some musicians are doctors” Actually: It could be that all musicians are doctors (making the implication true) or no musicians are doctors (making it false). You can’t deduce it from the statement.
Fallacy 2: Reversing “All A are B” Invalid: “All engineers are educated” does NOT mean “All educated people are engineers” Actually: All engineers are in the educated category, but many educated non-engineers exist.
Fallacy 3: Combining “Some” statements incorrectly Given: “Some doctors are musicians” and “Some musicians are artists” Invalid conclusion: “Some doctors are artists” Actually: It’s possible no overlap exists between doctors and artists. The musicians overlap separately with each.
Recognizing these fallacies prevents selecting incorrect answers that feel logically sound but violate set theory rules.
6. Use Venn Diagrams to Test Syllogism Validity
Remember syllogisms from Chapter 3? Venn diagrams provide a visual way to verify whether syllogisms are valid.
Example syllogism: Premise 1: All doctors are educated Premise 2: All educated people are responsible Conclusion: All doctors are responsible
Diagram representation:
- Circle D (Doctors) inside Circle E (Educated)
- Circle E inside Circle R (Responsible)
- Therefore: Circle D is inside Circle R
- Conclusion is valid
Invalid syllogism: Premise 1: All teachers are educated Premise 2: Some athletes are educated Conclusion: Some athletes are teachers
Diagram representation:
- Circle T (Teachers) inside Circle E (Educated)
- Circle A (Athletes) overlaps with Circle E
- But A could overlap with E in a region where T doesn’t exist
- Conclusion is not necessarily valid
Venn diagrams make validity transparent visually.
7. Handle Complex Multi-Set Scenarios
Some questions involve four or more sets, making traditional Venn diagrams difficult to draw.
Strategy: Rather than trying to draw five overlapping circles, convert the problem into logical statements and work through the implications.
Example: All A are B. No B are C. Some C are D. Is it possible that some A are D?
Logical analysis:
- If A are inside B, and B and C don’t overlap, then A and C don’t overlap
- Therefore A and D cannot overlap (since D is related to C)
- So no, some A cannot be D
Working logically rather than drawing prevents confusion when diagrams become unwieldy.
8. Distinguish Between “Possible” and “Necessary” Conclusions
Exam questions often ask whether conclusions are definitely true, possibly true, or definitely false.
Definitely true: The conclusion must be true based on the premises. The diagram shows no alternative possibility. Example: All birds have wings. Pigeons are birds. Therefore pigeons have wings. (Definitely true)
Possibly true: The conclusion could be true, but other scenarios also fit the premises. Example: All birds have wings. Some creatures with wings are pigeons. Do all creatures with wings fly? (Possibly true, depends on other information)
Definitely false: The conclusion contradicts the premises. Example: Some doctors are musicians. Therefore no musicians are doctors. (Definitely false)
Recognizing this distinction prevents incorrect answers that claim conclusions are definite when they’re only possible.
9. Practice With Previous Years’ Venn Diagram Questions
Building Venn diagram skill develops fastest through consistent practice with real exam questions.
Spend time solving Venn diagram questions from previous years’ papers. Start with two-set problems to build intuition, then progress to three-set and complex scenarios. After solving 30-40 real exam Venn diagram questions, converting statements to diagrams becomes automatic.
Keep an error log. When you miss a question, note whether the error came from misinterpreting a statement, misplacing information in the diagram, or drawing invalid conclusions from the diagram. Targeted reflection builds genuine skill rather than lucky guessing.
10. Time Management and Exam Strategy for Venn Diagrams
Venn diagram questions typically take 20-30 seconds once you’ve built conversion skill. However, complex three-set or multi-set problems might take 45-60 seconds.
Strategic approach: carefully read each statement, convert it to diagram position, then answer the question based on the completed diagram. Don’t skip the conversion step even if it feels slow. The extra 10 seconds spent on accurate conversion saves 30 seconds of confusion later.
If you struggle with mental visualization, sketch quick circles on paper during the exam. The time spent sketching is minimal and accuracy improves dramatically.
Never assume relationships not explicitly stated. Stick to what the premises tell you. Invalid conclusions often arise from assuming information that sounds logical but isn’t given.
How OdTutor Strengthens This Skill
Venn diagrams reward systematic statement-to-diagram conversion combined with careful logical reasoning, both developing fastest through guided practice with real exam examples. At OdTutor, our teachers help you master statement conversion, recognize common logical fallacies, and develop the diagram-drawing habits that make complex problems transparent. With personalized feedback on whether your Venn diagram misses stem from conversion errors, visualization gaps, or logical fallacy confusion, our trainers help you solve Venn diagram questions with confidence under exam pressure.
Quick Practice Quiz
Here’s a short interactive quiz to test these techniques. Five Venn Diagram questions mixing two-set, three-set, and complex scenarios.